Navigation
Please report any issues or errors to hug@cs.berkeley.edu.
DoubleChain
For this problem, we'll define a new data structure, the DoubleChain. A DoubleChain is similar to the SList, except that it is made of nodes with both forward and backward links, and its get methods return Nodes instead of values. A DoubleChain is made of DNodes, where each DNode has three member variables for:
- A previous DNode
- A double value
- A next DNode
You will be implementing the DoubleChain class using the SList class as a guide. Your class should support the following public methods:
| Modifier and Type | Method and Description |
|---|---|
| public DNode | getBack() Returns the back node of a DoubleChain. |
| public DNode | getFront() Returns the front node of a DoubleChain. |
| public void | insertBack(double val) Inserts a DNode with a value of VAL at the back of a DoubleChain. |
| public void | insertFront(double val) Inserts a DNode with a value of VAL at the front of a DoubleChain. |
| public DNode | deleteBack() Returns the back Node of a DoubleChain and removes it from the DoubleChain. Does nothing if the DoubleChain is empty (ie head is null). (optional) |
| public String | toString() Returns a string representation of a DoubleChain. (optional) |
A skeleton for TestDoubleChain has been provided for you containing rudimentary tests.
This specific data structure is a bit odd. Real lists would not return DNodes, but would instead return doubles (similar to SLists). However, for pedagogical purposes and to make it easier to test your code, we're having you return the actual nodes.
Note: You may wonder where the DNode class is defined. We're using a new fancy trick where DList.java defines two classes inside the same .java file, namely DList and DNode. We'll be covering this in class on Friday. See HFJ page 376 (and 377-378 if you're curious).
Basic Functionality Test
Open up TestDoubleChain. You'll see that unlike the tests you wrote for hw2 and lab2 that verify only a single method at once, our DoubleChain tests call multiple methods before making an assertEquals call. The reason here is simple: We rely on the get methods to ensure that the insert methods work.
Feel free to augment these tests if you'd like. Important note: The DNode class does NOT provide an equals method. Therefore assertEquals(d1, d2) will not work if d1 and d2 are DNodes.
DoubleChain Implementation
Implement the single argument constructor and verify that it works. Then implement the insert and get methods so that they pass the tests. If this takes you more than an hour, move on to the next task so you can get some practice with the debugger.
Sleuthing with a Debugger
You've been there. 2 AM, blankly staring at that lump of code that refuses to work and you don't know why. In the past, you've likely used print statements to sniff out the offending bug. One sometimes powerful alternative is the use of a debugger. A debugger is a simple tool that can do everything you could with print statements and more without the mess and tedium of adding and removing print statements (but with its own mess and tedium). We don't convince today to compeletely convince you that debuggers are awesome since much of what you can do today can also be achieved with print statements (and without the learning curve). However, as you gain practice as a programmer, you'll find that a debugger can ultimately save you a lot of time.
Today, we'll give you a quick walkthrough on how to use gjdb or Eclipse then throw a quirky bit of code for you to figure out. Use whichever you like! To jump to the Eclipse version, click here
gjdb Setup
For a quick gjdb usage video (doing the first part of this lab), see this link.
You can use gjdb either from the command line or using Emacs. If you're using your own computer and haven't completed lab 1d, you should log into the instructional machines for this part.
For gjdb to work, it's important that your java files are compiled using the -g option, e.g.
javac -g *.javaTo run gjdb from the command line on your own computer, type:
java ucb.gjdb.GJDB HopperSee lab 1d if this command does not work.
Or if on a lab computer, type:
gjdb Hopper
To run gjdb from within Emacs, use the M-x gjdb command in Emacs. When asked to fill in the gjdb command, use gjdb Hopper
Once you've started using gjdb, it'll prompt you using [-]
Let's now use the run command:
[-] run
Your program will run starting from the beginning, just like when you start it up using the java command.
Running gjdb
We'll be learning the few basic commands that express much of the power of a debugger:
- break
- step over (next)
- step into (step)
- finish
- continue
Breakpoints
When we used the run command, we simply ran from the beginning of main to the end. What if we want to go through the code line by line? That's easy! We just set a breakpoint. A breakpoint is like a stop sign telling the program to halt and await further instructions.
Let's add a breakpoint to our file. Type the command below:
[-] break Hopper.mainAs you might guess, this will put a breakpoint right at the start of the main method of Hopper. Now type run and say that you would indeed like to restart the program. If you're using Emacs, your Window will split and you'll get a nicely annotated view of your code withan arrow showing you exactly where in the code you stopped at.
Controlling Program Flow
Now that we've successfully stopped the code right where we want it, we can start going over this code line by line. To execute the current line of code that we're at and go to the next line, we simply use the command next (or n for short). This is called stepping over. To check that this line has actually executed, let's print out the value of val. To do this, we simply type p val (The p is short for print). If you'd like to see all the local variables, simply type
info locals For now, we should just see val since that is the only local variable we've declared.
Keep stepping until we are at the line we declare rock, but don't execute it quite yet. With next, we simply executed the line we were currently at. However, if we're at a method call, we have another option at our disposal: step. If we choose to use step at a line with one or more method calls, we'll step into those method calls in order. Let's try step here. You will find that we are suddenly in the code of the constructor of StringList. Cool stuff! Feel free to step into or over as many lines as you'd like. Once you're done smelling the roses, use the command finish to go back to where we once were; adding the string "1" to rock. As you can see, if you call finish while in a method call, you will finish execution of that method call and return to the code that originally called that method.
Now suppose you've stopped at one line and would like to skip a bunch of the stuff between where you are and where you want to be. What should you do if you don't want to step over very line in between (think about this one a bit before moving on)? If you're like me, you'll want to set another breakpoint where you want to go. Let's head to that line that seems interesting using the following syntax:
break Hopper:<line#>
continue
continue simply runs execution from the line we're at until either our code terminates or it hits another breakpoint. rock has been through quite a journey up until this point; let's see what's become of it. Try printing rock using p rock. You'll see that gjdb simply tell you that it's an ArrayList along with its id. That doesn't tell us quite much; code is like an onion (or an ogre) and often we care about the layers of data. To print details, use the print/n command. The bigger n is, the more layers of data we print. Try experimenting with variable numbers of n at this point.
When you're finally done with your inspection and want to let the code run on it's merry way, simply continue the program.
Flik
Now that you've got a handle on the basics, it's time to take those skills and apply them. We are going to look at the Flik.java file. Some curious behaviour occurs here. For some bizarre reason, it prints out "i is 128". Your job is to figure out why. You might find conditional breakpoints useful for this exercise. You can find the documentation about them here. You may also find the last two pages of the documentation useful as a reference.
Write your findings in answer.txt. No more than 4 sentences.
Also, a note on autoboxing: When you pass an int value to an Integer parameter, Java interconverts between them using the valueOf method in a process known as 'autoboxing'. We'll talk more about this later, but just be warned that if you reach valueOf instead of what you were expecting, Java is probably autoboxing.
You're done debugging. To jump to the extra exercises for today, head here
Using the Eclipse debugger
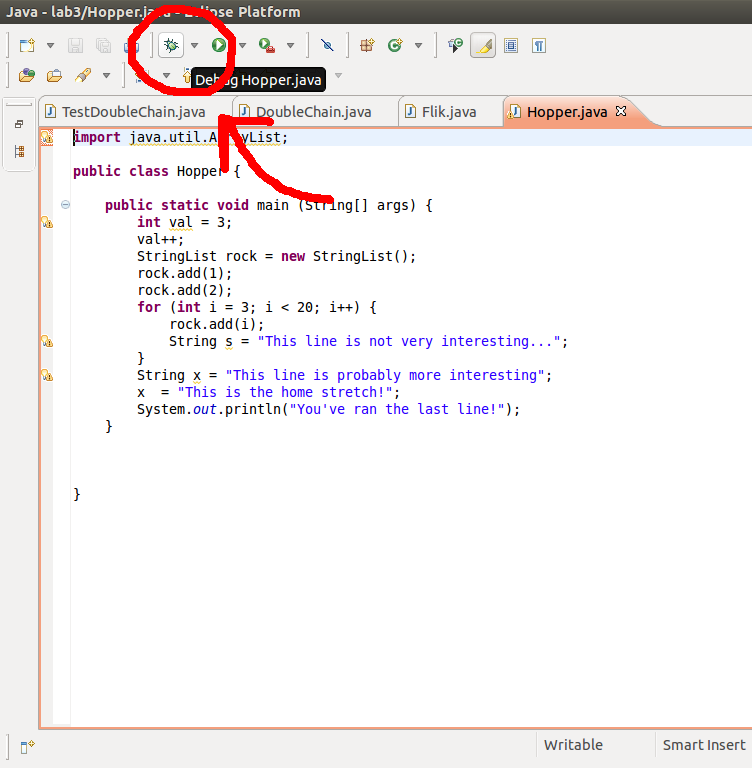
To run a program in debug mode, run it the exact same way you would normally, except instead of using the green arrow-in-a-circle button, use the bug button. See below:
Your program will run starting from the beginning, just like normal. So far, no difference.
Breakpoints
When we ran in debug mode, we simply ran from the beginning of main to the end. This isn't very helpful. What's useful about a debugger is that we can use it to walk through code slowly, line by line, at each step examining the variables to understand what they're doing. To do this, we're going to need a breakpoint. A breakpoint is like a stop sign telling the program to halt while we examine it.
Let's add a breakpoint to a program to practice. Open the file Hopper.java. On the first line of main, double click in the left margin. A blue dot should appear. This is a breakpoint. Here it is:
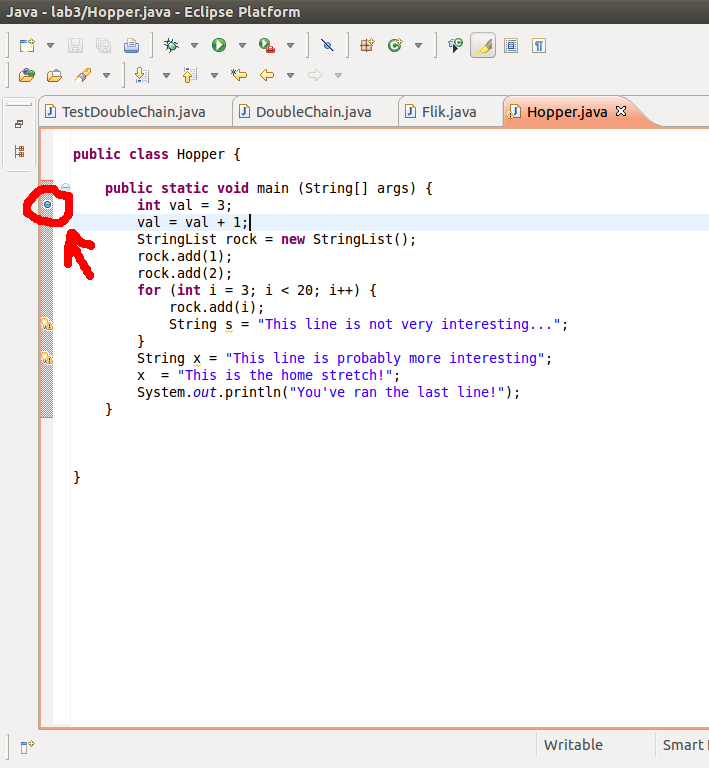
(Don't worry if your breakpoint is hidden behind a warning sign, by the way. Even if you can't see it, it can still be there).
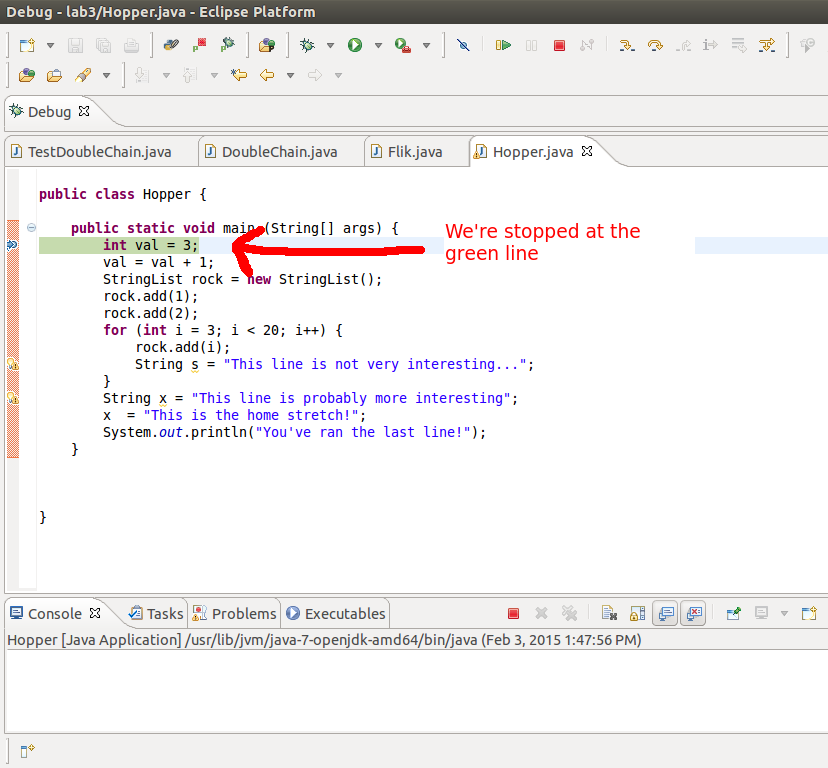
Now run in debug mode (by hitting the bug button). The program starts executing like normal but it should pause at the breakpoint. The line should be highlighted showing where the program is currently halted.
Controlling Program Flow
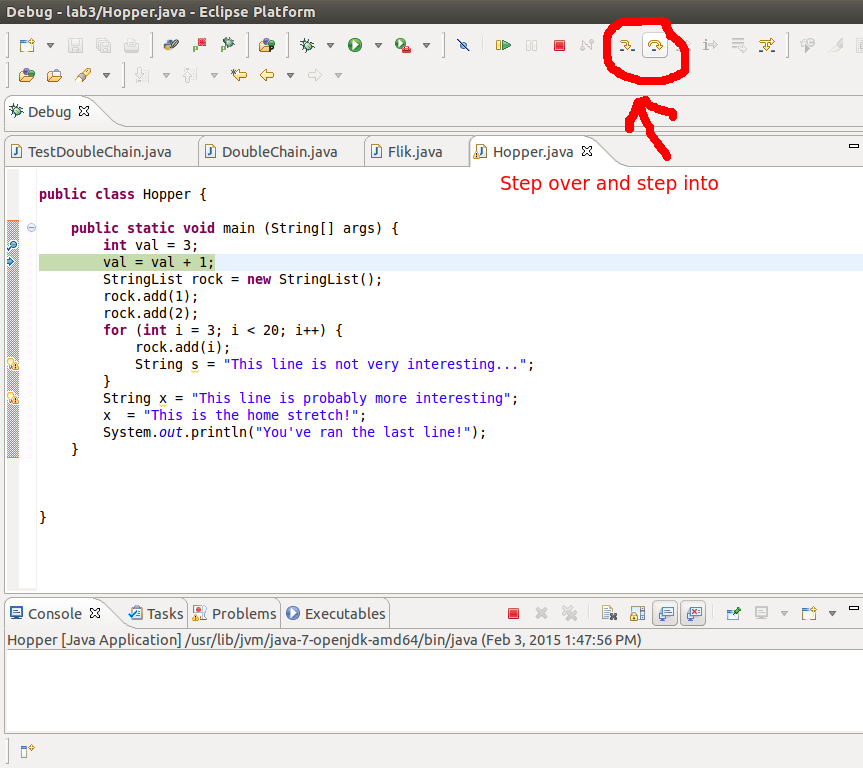
Now that we've successfully stopped the code right where we want it, we can start going over this code line-by-line. To execute the current line of code that we're at and go to the next line, click the "Step Over" button in the toolbar (or hit its keyboard shortcut). Here it is, along with "Step Into" (which will be explained shortly):
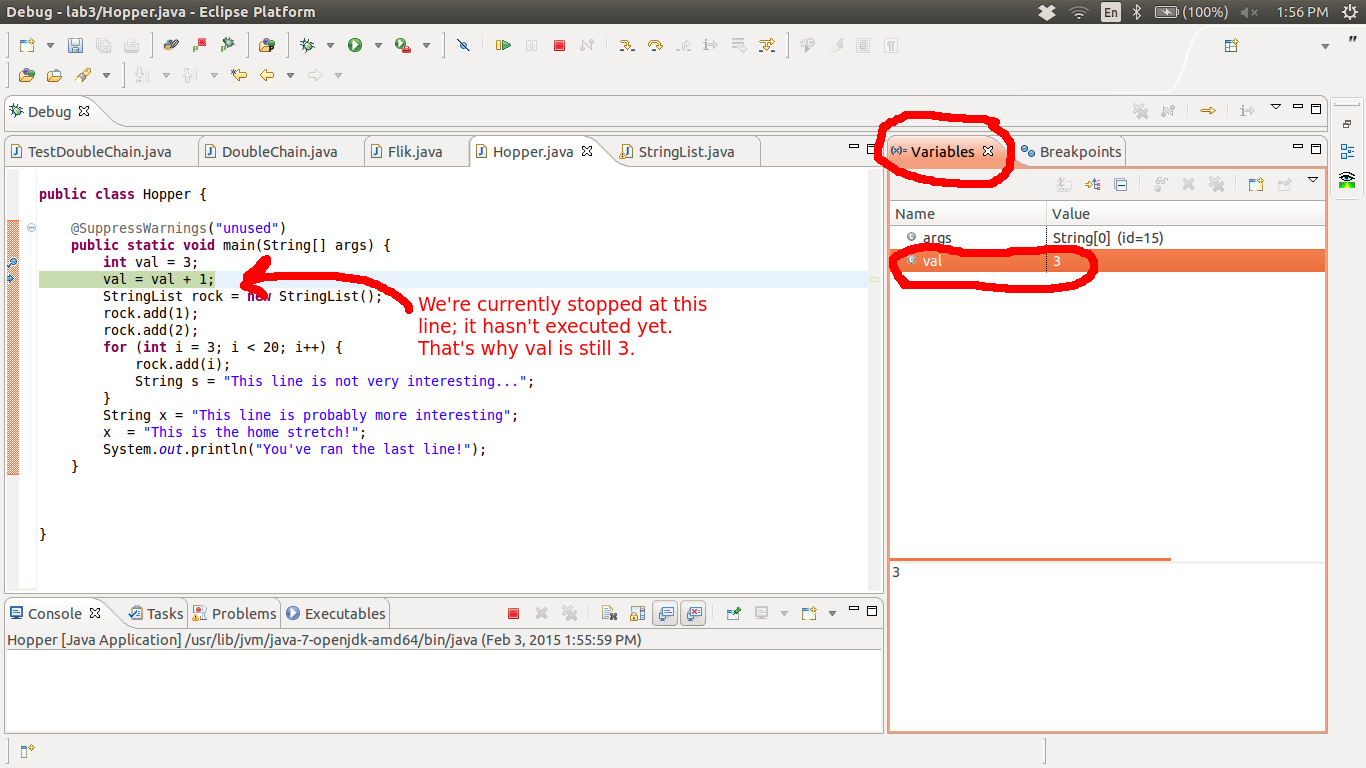
To check that this line has actually executed, let's examine the value of val. To do this, look in the Variables tab. The Variables tab shows all the local variables at this line. Click on val, and verify that it is in fact 3. (If you don't see the Variables tab, go to Window > Show View > Variables). Here's the Variables tab:
Keep stepping until we are at the line where we add "1" to rock, but don't execute it quite yet. If we hit "Step Over", we would simply execute the line we were currently at and move on to the next. However, since we're at a line with a method call, we have another option at our disposal: "Step Into". If we choose to use step into at a line with one or more method calls, we'll jump to the first line inside one of the method calls!
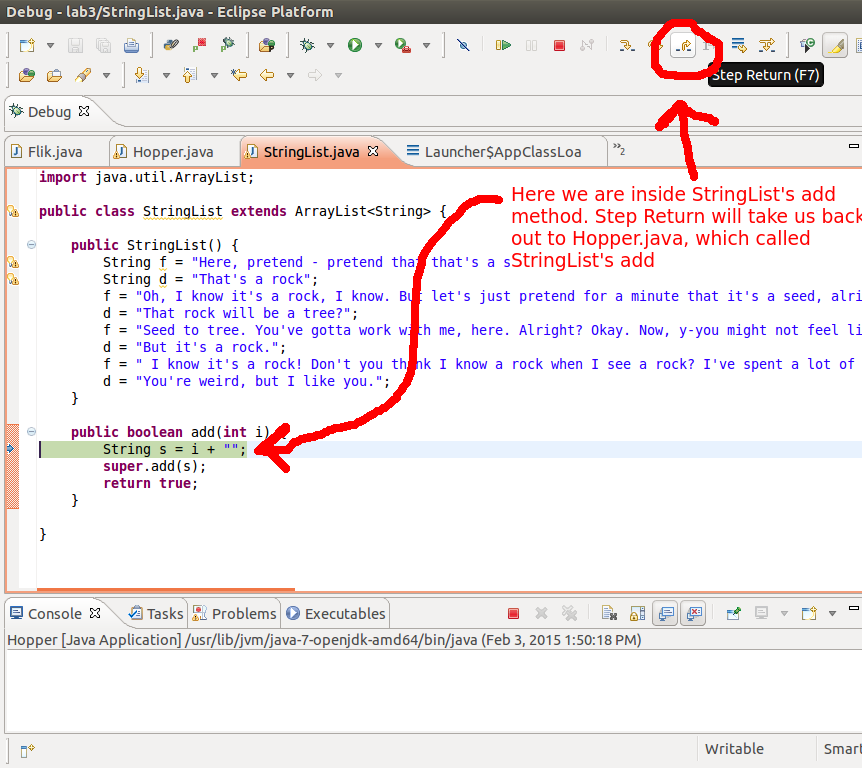
Let's try stepping in here. You will find yourself suddenly in the code of StringList's add method. Cool stuff! Once you're done here in StringList, use the command "Step Return" to go back to where we once were, back in Hopper. (Or, if you step over all the lines in add, you'll automatically return to Hopper).
To sum up: "Step Over" executes a line and takes us to the next line. "Step Into" allows us to look into the code inside a method call. "Step Return" takes us out of the current method call we're in and back to where that method was called.
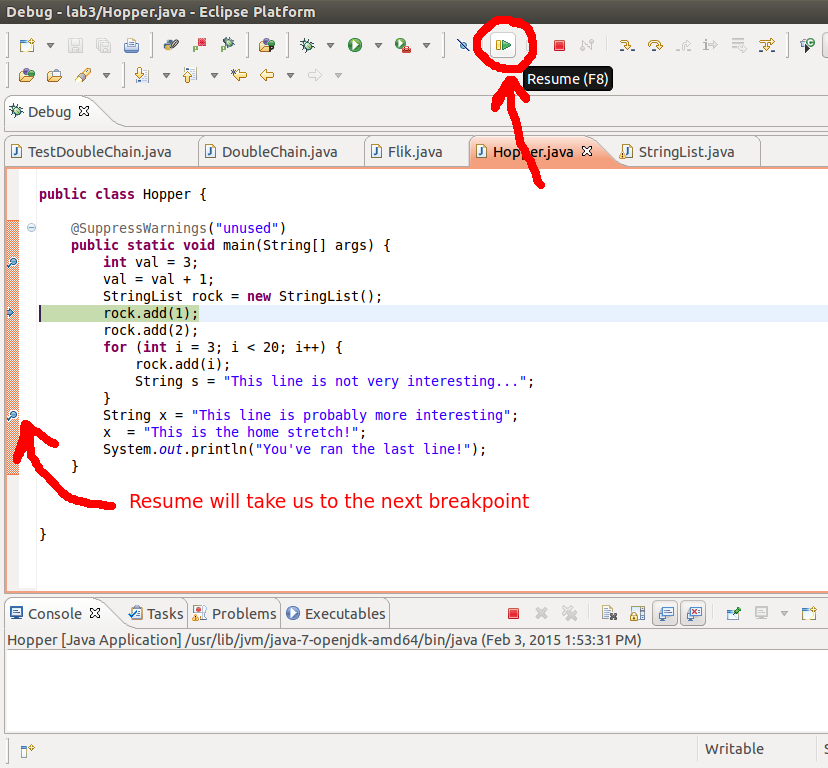
Now suppose you've stopped at one line and would like to skip a bunch of the stuff between where you are and where you want to be. What should you do if you don't want to step over very line in between (think about this one a bit before moving on)? If you're like me, you'll want to set another breakpoint where you want to go. Let's head to that line that seems interesting by setting a new breakpoint at it. Now hit the "Resume" button. The code will run automatically until it hits the new breakpoint.
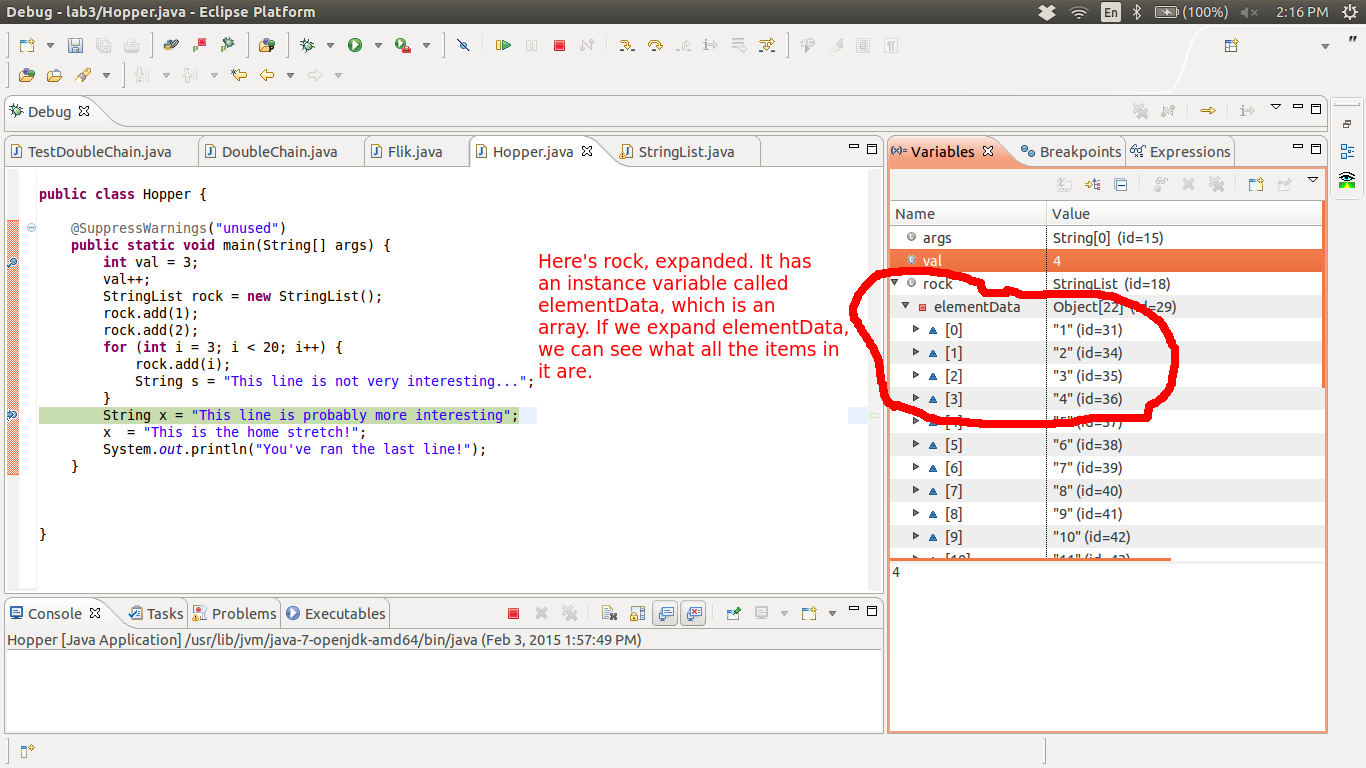
rock has been through quite a journey up until this point; let's see what's become of it. Try examining rock in the Variables tab. You'll notice that it shows you all the values in it. Pretty neat! In addition, since rock is an object with instance variables, you can also examine those. Click the little arrow next to rock in the Variables tab to see all of its instance variables. If these further have their own instance variables, you can expand those as well.
Flik
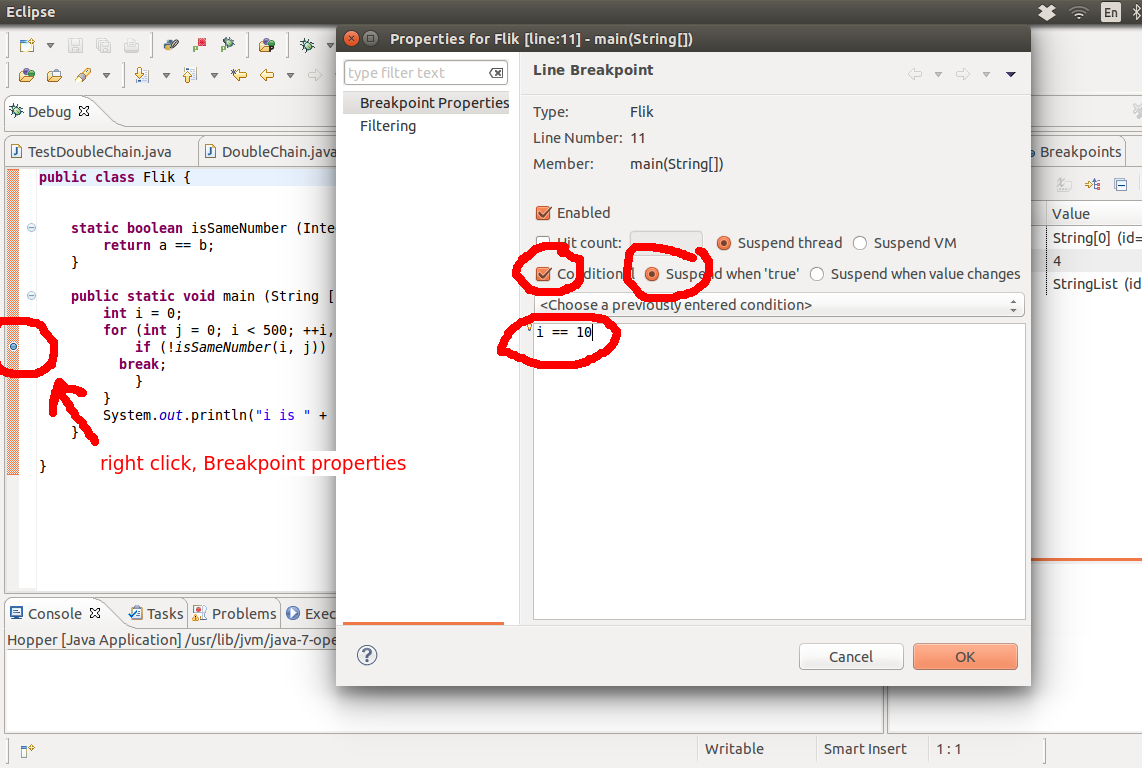
Now that you've got a handle on the basics, it's time to take those skills and apply them. We are going to look at the Flik.java file. Some curious behaviour occurs here. For some bizarre reason, it prints out "i is 128". Your job is to debug this code. You might find conditional breakpoints useful for this exercise. To set a conditional breakpoint, first create a breakpoint like normal. Then right-click on the breakpoint and select "Breakpoint Properties". Check the "Conditional" box and enter an expression, then hit "OK". Now the code will only stop at the breakpoint if the expression is true! You'll definitely find this feature useful as you continue programming.
Here's an example of a conditional breakpoint that stops when i = 10. Maybe not a very useful condition, but it's just an example:
Write your findings about the bug in the code in answer.txt. No more than 4 sentences.
Also, a note on autoboxing. When Java autoboxes ints it uses the valueOf method. If you're stepping into a method and reach valueOf instead of what you were expecting, Java is probably autoboxing.
One More Feature
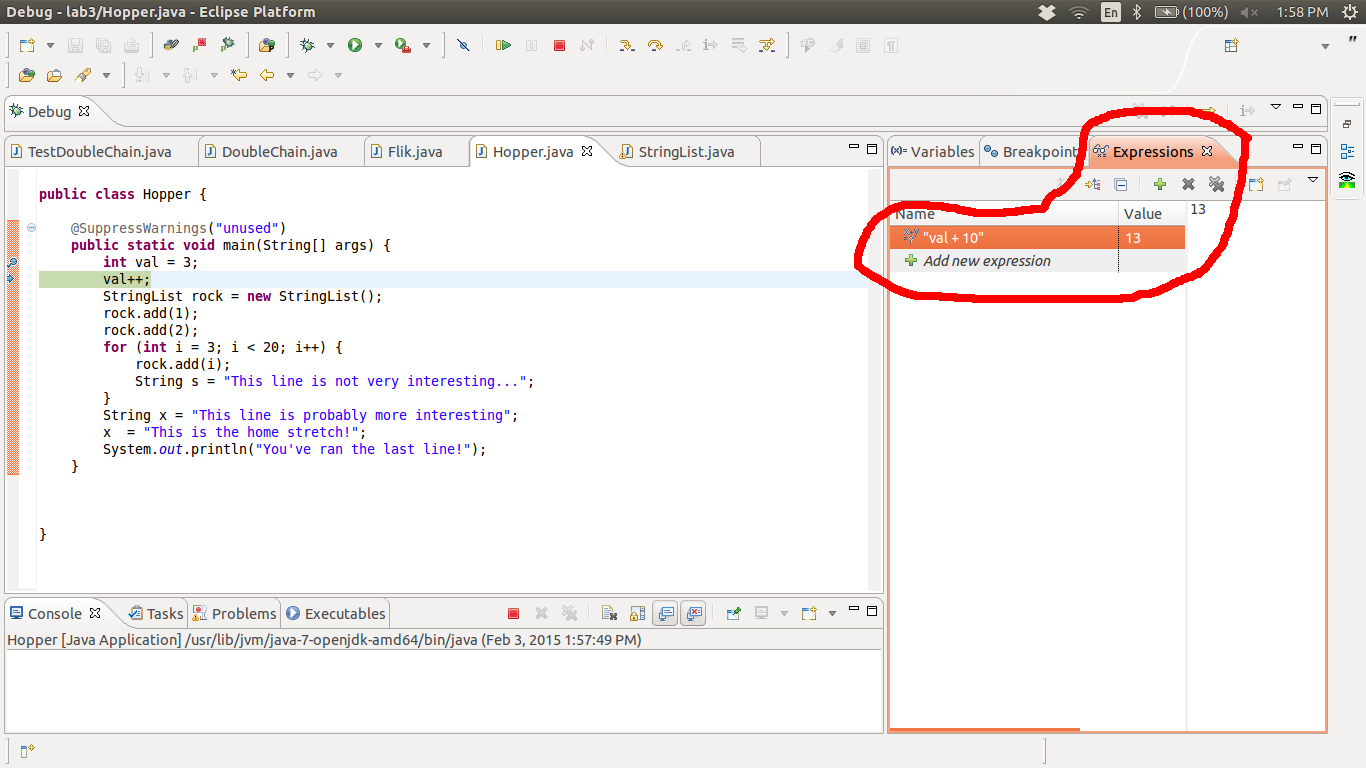
Another extremely powerful feature of the Eclipse debugger is the Expressions tab. Let's try it out on Hopper. Set a breakpoint after val is set to 3, and run the debugger. When it breaks, check out val in the Variables tab and make sure it's 3.
Now for the cool part. Look at the Expressions tab (if you don't see it, go to Window > Show View > Expressions). You can type whatever code you want here and see what it evaluates to. As an example, type in val+10 and hit enter. It'll show us 13!
You can even modify the values of variables in the Expressions tab. Type in val = 100. Then go back to the Variables tab and check val. It changed to 100, and it will remain that way when you continue running your code!
Beware: whether you click on them or not, all of your expressions automatically run whenever you hit a breakpoint. So if you don't want to set val to 100 every time you hit a breakpoint, you should delete the expression when you're done with it.
Challenge 1: toString
Now we're back to DoubleChains. These exercises are optional but recommended. If you don't complete this method before the end of lab, it's ok to submit what you have for full credit, though it's probably better if you finish it, just so you get the practice.
In this final section of the lab, we'll build a toString method. Your method will convert the DoubleChain into a comma-separated list flanked by <[ on the left and ]> on the right. For example, a DoubleChain consisting of the values 1.0, 2.1, 3.3, 4.6, and 5.2 would be converted by toString into:
<[1.0, 2.1, 3.3, 4.6, 5.2]>As usual, add a testToString method in TestDoubleChain and verify that it fails. Then write the toString method. Feel free to create private helper methods to keep things organized. If it seems worth it to test any helper methods, it's ok to make them public to allow TestDoubleChain to access them. Making a method public just to allow it to be tested is not ideal, since it means we have to expose more of the implementation details.
Challenge 2: Deletion operations
For an added challenge, write a method deleteByIndex(int i) that deletes the ith item from the front.
For an even bigger challenge, write a method deleteByValue(double val) that deletes all items approximately equal to a given value.